HOW DO I CREATE SVG IN MICROSOFT POWERPOINT?
2 min read
PowerPoint is a creative tool that is easy and rich in features. In Microsoft PowerPoint, you can create beautiful diagrams and save them as SVG.
For readers who don’t know about SVG, let’s first get a quick glimpse of the SVG format.
WHAT IS SVG?
SVG means Scalable Vector Graphics. It is a vector format. In layman language, if you design some diagram and save it as an SVG, it will be a vector. Whenever you use this SVG in your documents or printables, no matter how much you scale it, it will not pixelate or become blurred.
To understand it better, let’s take a look at the screenshots below.


The picture on the left is vector (SVG) and the one on the right is an image.
If under any scenario you want to use a high-resolution graphic and use this image (on the right), it will start pixelating when you will scale it.
If you use SVG format, the pixels will stay intact without losing the quality of the graphic.
Let’s take a look at the scaled version. Here you can see that SVG holds the quality while the image loses it.


HOW DO I CREATE SVG IN POWERPOINT?
You can create SVG easily in PowerPoint without the need for any other software.
Create the diagram or graphic in the PowerPoint that want to convert into SVG.
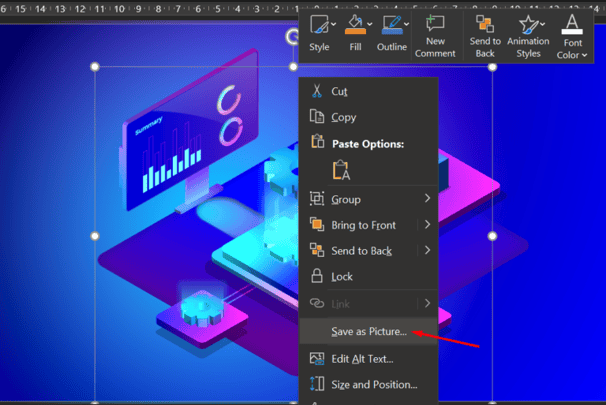
Here is an example below that I have created in PowerPoint.


To convert it into SVG, all you need to do is right-click on the graphic and click on “save as picture”.


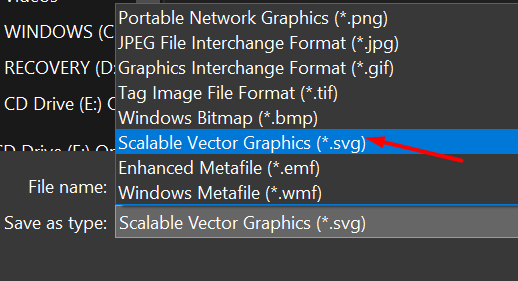
Now the save option will appear. You need to click on the save as SVG and then press the save button.


Now the graphic is saved as an SVG. You can copy and paste it on the PowerPoint slide to use it. Now you can scale it as per the requirements and it will not pixelate.
I hope you learned how to use SVG in PowerPoint. Please share the blog if you learned something new today.
